白皮书下载
data statistics
In order to help users understand the execution of tasks, the z-bot terminal robot provides visual data statistical reports. It is expanded from three dimensions: key indicators, execution times trend and execution time distribution.
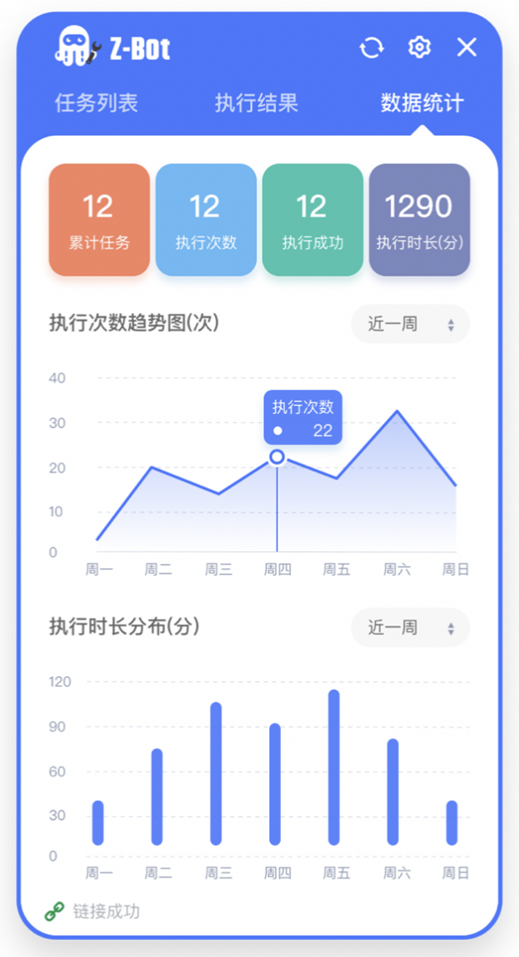
Summary of key indicators
Key indicators include cumulative tasks, execution times, successful execution times and execution duration, which are summarized respectively. The summary range is the cumulative value in the history of the terminal robot, with a maximum duration of 1 year. Cumulative tasks refer to the number of tasks downloaded by the z-bot terminal robot, including existing and deleted tasks; Execution times refers to the total number of execution times of all running tasks, including successful and abnormal. As long as execution is clicked or timed cycle execution is activated, it is regarded as execution; Successful execution, that is, the number of successful execution of all tasks; Execution duration: the total value of all executed tasks and the time length of each execution, expressed in & ldquo; Minutes & rdquo; As a unit, we can indirectly see how long automation has taken, and even how much savings and efficiency have been provided for the company.
Trend chart of execution times
Take the day as the unit, look at the number of tasks performed by the z-bot terminal robot every day, that is, the trend distribution diagram. You can switch the time. You can view the time of recent week and recent month. The default is recent week. You can understand the execution of z-bot terminal robot every day. The abscissa of the trend chart is the date, and the natural day is the minimum granularity; The ordinate is the number of execution times, and the maximum number of times under jurisdiction is the maximum scale of the coordinate, which is divided into 5 equal parts.
Execution time distribution
Similar to the execution times trend chart, the execution time distribution looks at the execution time distribution of the daily task of the z-bot terminal robot, that is, the effective utilization of the terminal robot. The duration unit is & ldquo; Minutes & rdquo;. You can switch the time. You can view the time of recent week and recent month. The default is recent week. The abscissa of the distribution map is the date, and the natural day is the minimum granularity; The ordinate is the execution duration, and the maximum duration of the time under its jurisdiction is the maximum scale of the coordinate, which is divided into 5 equal parts.